

ERCIM News No.37 - April 1999
ERCIM News No.37 - April 1999
Monitoring and Displaying Traffic on the World Wide Web
by Evangelos P. Markatos and Athanasios E. Papathanasiou
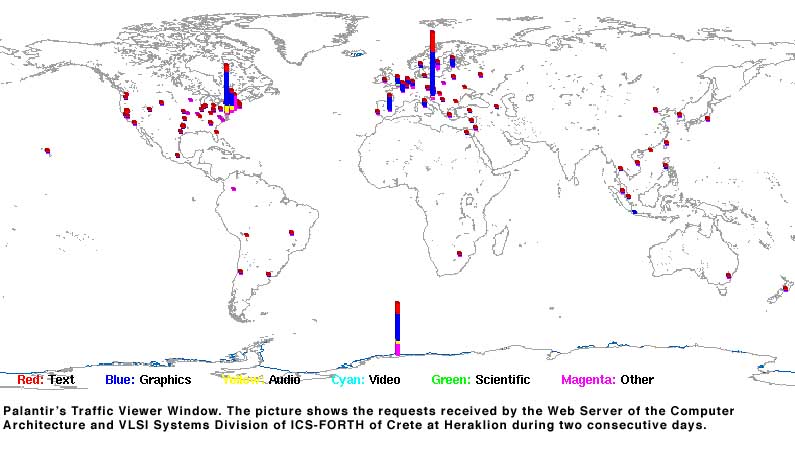
Developed by the Computer Architecture and VLSI Group at the Institute of Computer Science - FORTH, Palantir is an application that can be used to display the origin, volume and type of the incoming requests of a web server. A good knowledge of the geographic distribution and access patterns of the clients creating these requests may indicate a more efficient way of erving them.
World-Wide Web traffic continues to increase at impressive rates. Busy web servers may get as many as several millions of hits (accesses) in a day. Accesses may originate from all over the world and may result in a ‘rush hour’ that lasts 24-hours per day. Web traffic will probably continue to increase as more people gain access and new applications (including commercial ones) are emerging. To meet the demands of this ever-increasing traffic, webmasters should design their web servers in such a way as to disseminate information (and sell or advertise products) effectively and reliably. A first step towards effective information dissemination is understanding a web server’s client base, and reaching out to it. Palantir is a web traffic monitor and visualization tool that can be used to display the origin, volume and type of the incoming requests of a web server. A good knowledge of the geographic distribution and access patterns of the clients creating these requests may indicate a more efficient way of serving them.
Palantir reads the log files of a web server and after categorizing the requests into six major types (text, graphics, audio, video, scientific, and other - that is any other kind of request) displays the origin of the requests on a geographical landscape (in pictorial form). The geographical origin of the request is found by comparing its IP address to databases of information about geographical locations of the address. In the case of addresses registered in the US, the addresses are compared to registry databases and then that information in compared against a zipcode database to determine the geographic origination of the address. The type and magnitude of requests that originate from each region are shown in the map either stacked bars or as concentric circles. Different types of requests are easily identified by being displayed with different colors.
Palantir can animate the web traffic in static mode or in dynamic mode. In the first case, the requests, which have occurred during a specific period of time and are contained in the selected log files, are animated in the viewer. Each request remains displayed until the end of the simulation (it has an unlimited time life). Thus, the stacked bars (or the concentric circles) present the total amount of requests cumulatively (summary of traffic over a specified period). In the Dynamic mode, Palantir’s viewer tries to capture the instant traffic of requests. Each request, contained in the log file, is considered to have a limited time life. As time passes, new requests are displayed on the viewer, while those that have exceeded their time life (old requests) are deleted. In this way a visualization of the way that network traffic varies with time is given! Moreover, Palantir checks continually the log file to display new incoming requests at real-time.
To facilitate its use, Palantir provides an graphical interface with several functions most important of which are:
- aggregation: requests originating from several predefined (or user-defined) regions are aggregated into a single stacked bar (or concentric cycle)
- zooming: Palantir may zoom in a specific location in order to study more effectively the traffic that originates from a particular geographic region.
- filtering: Palantir provides two kinds of filters: Domain Filter and Request Filter. The Domain Filter is used to display only requests that come from a specified domain, while the Request Filter displays only those requests that ask for a specific kind of files.
Palantir is completely written in Java, mainly for portability reasons and may be accessed though its Home Page at ICS-FORTH: http://archvlsi.ics.forth.gr/OS/www.html.
A Palantir server is currently running at http://sappho.ics.forth.gr:9000, which may be freely used for downloading Log files and viewing Network Traffic Visualizations.
Current plans for Palantir include visualizing a domain’s outgoing requests. A simple way for achieving this is by monitoring outgoing TCP packets that have as a destination port the 80 port (default port for http requests) of a host.Please contact
Evangelos P. Markatos - ICS-FORTH
Tel: +30 81 391655
E-mail: markatos@ics.forth.gr
Athanasios E. Papathanasiou - ICS-FORTH
Tel: +30 81 391437
E-mail: papathan@ics.forth.gr