

by Henk Nieland
Cluster analysis is a very general method of explorative data analysis applied in fields like biology, pattern recognition, linguistics, psychology and sociology. The aim is to recognize ‘natural’ groups within a class of entities. A fast algorithm was developed at CWI to disclose cluster structure in data represented as graphs. This Markov Cluster algorithm (MCL) is based on random walks on a graph, uses simple algebraic operations on its associated stochastic matrix, and does not require a priori knowledge about an underlying cluster structure.
The ability to distinguish close groups of entities, or clusters, is inherent in all living beings. This power of observation is in fact as important for survival as is food. Also consciously we frequently apply the method of clustering. It goes back to Greek antiquity, when Aristotle attempted to classify all living organisms. Cluster analysis on medical data in order to gain insight into a still not understood disease is a typical modern application.
In several cases data can be represented as a graph, consisting of a collection of nodes with their interconnections (edges). The World Wide Web is here an appealing example. CWI researcher Stijn van Dongen has invented a fast algorithm for automatic graph clustering. It is fast because it only uses very simple algebraic operations. This Markov Cluster algorithm (MCL) utilizes the notion of random walk for the retrieval of cluster structure in a graph. In a random walk at each node the direction to be followed is given by chance. Imagine a vast collection of random walks, all starting from the same point. Walkers will in general follow different paths. An observer floating high above them will see a flow: the crowd slowly swirles and disperses, much as if a drop of ink is spilled into a water-filled tray.
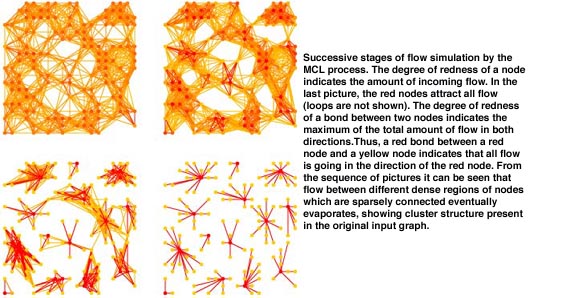
The aim of a cluster method is to dissect a graph into regions with many edges inside, and with only a few edges between regions. Once inside such a region, a random walker has little chance to get out. The idea behind MCL is very simple. Simulate many random walks (or flow) within the whole graph, and strengthen flow where it is already strong, and weaken it where it is weak. By repeating the process an underlying cluster structure will gradually become visible. The process ends up with a number of regions with strong internal flow (clusters), separated by ‘dry’ boundaries with hardly any flow.
Mathematically flow is simulated by algebraic operations on the stochastic (Markov) matrix associated with the graph. Flow can be expanded by computing powers of this matrix. This operation allows flow to connect different regions of the graph, but will not exhibit underlying cluster structure. An ‘inflation’ operator (technically: the entry-wise Hadamard-Schur product combined with diagonal scaling) is responsible for both strengthening and weakening the flow.
The MCL method has also been applied to problems in pattern recognition. Here the pixels of a digitalized image are seen as the nodes of a graph, and are interconnected if their grey values differ only a little. The method was tested for fast recognition of sharp transitions in an image.
In several cluster problems, for example in the medical and social sciences, the data are described in a ‘vector’ model instead of a graph. A single item is characterized by a set of numbers, which can be seen as a vector in a multi-dimensional space. Vectors are close according to some distance measure. At first sight this concept is rather different from that of a graph. Although developed for graphs, the MCL method is also applicable to problems which are naturally better described in a vector model.
Please contact:
Stijn van Dongen - CWI
Tel: +31 20 691 3257
E-mail: stijnvd@cwi.nl, s.vandongen@chello.nl