

ERCIM News No.44 - January 2001 [contents]
ERCIM News No.44 - January 2001 [contents]
by Henk Huitema and Robert van Liere
Understanding the function of a protein is fundamental for gaining insight into many biological processes. Proteins are stable mechanical constructs that allow certain internal motions to enable their biological function. Structural properties of a protein can be obtained with X-ray crystallography or NMR acquisition techniques. Molecular dynamics (MD) simulations at pico/nano-second time scales output one or more trajectory files which describe the coordinates of each individual atom over time. The main problem with animating these trajectories is one of temporal scale. Taking large time steps will destroy the impression of smooth motion, while small time steps will result in the camouflage of interesting motions.
Together with the Department of Microbiology of the University of Amsterdam, CWI has developed an interactive visualization environment to study protein dynamics. Instead of animating atom trajectory files, essential dynamics is used to filter out non-interesting motions and only visualizing correlated atom motions. The basic idea of essential dynamics is to separate the configurational space into two subspaces: an essential subspace containing only a few degrees of freedom, and a remaining space in which the motions can be considered as physically constrained. The essential degrees of freedom describe motions which are relevant for the function of the protein, while the physically constrained subspace describes irrelevant local fluctuations. A number of interactive techniques are added to explore the configurational space spanned by the essential eigenvectors. One may drag one or more atoms along the eigenvector. The resulting new displacement is used to position other atoms in the protein. An angular widget to monitor the hinge bending properties can be pegged onto any part of the backbone. A measuring stick widget to monitor the distance between atoms during exploration can be pegged between two atoms.
These techniques have been used to study the dynamics of the Photoactive Yellow Protein (PYP). The 3D structure of PYP is known; it binds a chromophore via a thio-ester linkage to a unique cystine. When the chromophore receives blue light its conformation changes, which affects the overall structure and dynamics of the protein. How to animate internal protein motions?
One hypothesis is that a conformational change on the surface of PYP functions as a signalling device for another protein. Our visualization and interaction techniques help to find which domains in PYP are affected when the chromophore changes state, and which residues are involved in these conformational changes. Animation of the data provides a global overview of the internal protein motions and an indication of concerted fluctuations. Then exploration techniques are used to gain a deeper understanding of particular concerted motions. Finally, exploration combined with measuring widgets provide quantitative insight into the specific internal protein motions and fluctuations.
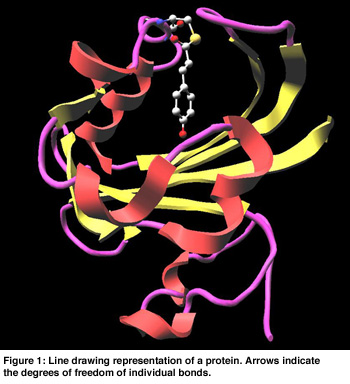
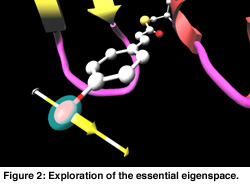
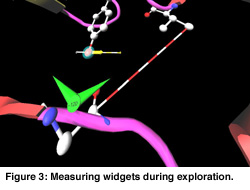
In Figure 1 a cartoon representation is used for the backbone (side groups are not shown). The chromophore is shown as a colored ball and stick representation. Animation of the MD trajectory reveals that the chromophore fluctuates considerably along the most relevant essential dynamics eigenvectors, and that these fluctuations are correlated with large motions on the backbone and side chains. In Figure 2, the eigenvector is drawn in yellow on a selected atom of the chromophore. The minimum and maximum bounds are displayed on a yellow-white cylinder. The atom is drawn as a semi-transparant sphere. Our exploration shows that the motion of the chromophore along the eigenvector induces a contraction of the 50-helix, causing the N-terminus region to pivot around the 25-turn (not shown in the Figure). Finally, Figure 3 shows an angular widget (drawn as a green compass) for measuring the dihedral angle that glycine-51 makes with the backbone. We could see that the large conformational freedom of this angle is responsible for the contraction of the 50-helix. The distance widget (shown as a red-white cylinder) is used to measure the distance between the 100-loop and the 50-helix.
Definite answers to the biochemical questions posed cannot be obtained by visualization alone. However, visualization helped to formulate a hypothesis which can be tested by further biochemical research. A candidate domain for the signaling function was found to be the N-terminal region. Critical residues for the conformational changes are glycine-51 and several residues in the 25-turn.
Our work revealed that filtering techniques enable the study of internal protein motions. Second, active exploration of the space spanned by the selected eigenvectors yields a more intuitive understanding than that of passive viewing of an animation. And finally, by exploration in combination with measuring widgets very specific properties of a motion may be examined.
Please contact:
Henk Huitema or Robert van Liere - CWI
Tel: +31 20 592 6020 / 4118
E-mail: {huitema|robertl}@cwi.nl